One of the challenges geomaticians face is integrating CAD data into their GIS, which contain crucial data that many organizations rely on to ensure their operations run smoothly. Plans for aqueducts, sewers, roads and buildings, among other things, are typically prepared by engineers (or technicians), with the help of drawing or design software that generates CAD data.
Because engineers and geomaticians don’t do the same type of work, they use software with different functionalities and formats. This is truer today than ever, as rapidly evolving software functionalities widen the gap between the two professions. This means that to be effective in their work, geomaticians need to make themselves indispensable to engineers, chiefly by understanding how to read and use CAD data.
Origins of CAD data
Computer‑aided design (CAD) technology paved the way for digital plans. The birth of CAD is usually associated with the advent of AutoCAD in the early 1980s, but the technology was actually being developed as early as the 1960s. The use of CAD in geomatics can be traced back to the early days of AutoCAD. Other software has been developed in the four decades since, including MicroStation and its DGN format, which is the most serious rival to the dominance of AutoCAD and its popular DWG format. CAD software has seen many advances over the years, with the latest editions—such as AutoCAD Civil 3D—able to handle dynamic 3D objects.
Structure and limits of CAD data
The purposes of CAD drawings and geomatics plans are different. In CAD drawings, the emphasis is on precision, design details and—especially—making the drawings clear and easy to understand. That’s why incomplete drawings of contextual elements (e.g., the beginning of a building, a nearby road, etc.) are common. In the case of geomatics plans, on the other hand, the structure of the plan is what’s most important, so contextual data isn’t especially useful.
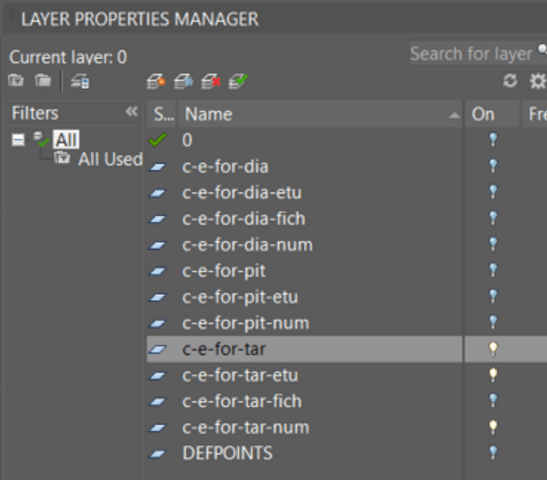
To understand CAD files, it’s good to know that most of them have a specific structure, and that the different types of information are found in the file’s layers. As with a GIS, the way data is displayed can be controlled by turning layers on or off.
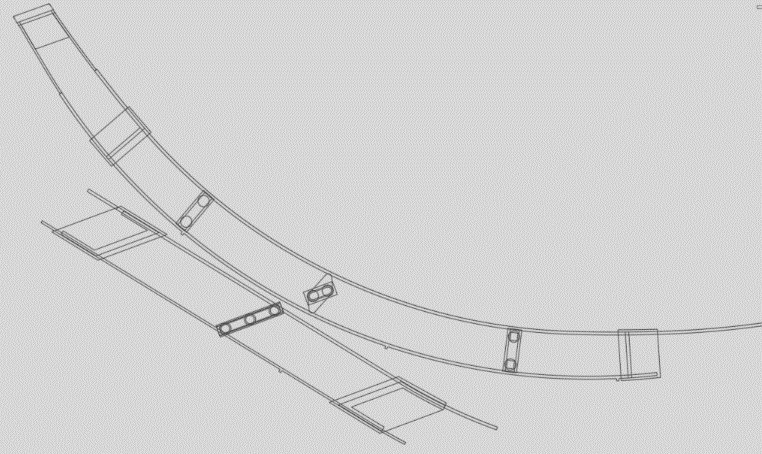
Plus, geometric precision and coordinates aren’t always required in CAD drawings. If the desired shape is clear to the human eye, it’s mission accomplished. With the exception of network plans generated in Civil 3D, topology rules are not required in CAD. Thus, it’s not uncommon to see shapes that look like polygons but are actually just polylines that haven’t been closed properly. It’s important to pay close attention to geomatic anomalies like this when converting CAD data to GIS formats. In addition, several geometric elements—such as arcs, circles and hatches—that aren’t supported in geomatics are supported in CAD drawings.
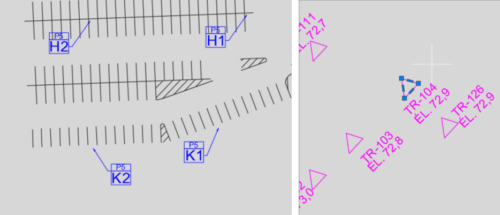
Finally, identification and measurement information will generally be indicated in text boxes near the entities or “connected” to the entities with an arrow. This information may include interesting descriptions of the entities to be integrated into the GIS.
Understanding the differences
The table below shows the main differences between CAD formats and the formats used in geomatics. One thing is clear: the advantages of one type of data are the drawbacks of the other.
| CAD plans (DWG, DXF, DGN, etc.) | Geomatics (SHP, FGDB, databases, etc.) | |
|---|---|---|
| Goal | Ability to create detailed drawings easily understood by multiple stakeholders. The chief interaction with the plan will be to consult it to complete the design. The plan is not intended for advanced analysis. |
Ability to create a structure that enables queries and analysis. The idea is to save information on physical elements spread across the study area. |
| Geometry support | Multiple geometries supported: points, lines, arcs, polygons, hatches, etc. | Three basic geometries: points, lines and polygons. Most elements can be represented using one of these geometries. |
| Information support | Accomplished through layer management, applying styles (line width, colour, etc.) and with annotations in text mode. | Each entity must be associated with all of its identifiers and other relevant information in an attribute table (e.g., material type, installation date, date of last update). |
| Other features | All shapes can be combined in a single layer with no loss in quality. | The attribute table can be in a separate file (e.g., SHP or DBF). In other cases, such as with spatially referenced databases, both attribute information and the geometric definition can be contained in a single field of the same table. |
Next step: Integrating CAD data into a GIS
Once geomaticians understand engineers’ and technicians’ objectives and the software they use, it will be easier for them to grasp the information in CAD files. The efficient integration of this data with GIS is crucial for a number of organizations, and this data must be interoperable between formats so that it can be properly processed, analyzed and communicated. In an upcoming article, we’ll take a look at best practices and useful tools to efficiently convert CAD data to GIS formats.
Do you need to convert CAD data to a GIS format, and you simply can’t afford to wait for our next article?