
Any governance strategy worth its salt involves process monitoring, both in terms of data processing and in terms of data validation and dissemination. For many organizations with an FME Server environment that sees a large volume of data, a monitoring strategy is essential, and even more so if the processing involves critical processes and data.
Get familiar with Dashboards
Are you thinking about deploying a monitoring strategy for your FME Server environment? We’ve got some good news for you: there’s a Safe Software feature that has everything you need. With FME Server Dashboards, you can keep an eye on your platform’s health at any given time.
By default, Dashboards gives you access to five different reports:
- Total number of jobs run per day
- Top 20 workspaces with failures reported in the last month
- Total time (in seconds) engines have spent running jobs
- Average time (in seconds) jobs have waited in the queue
- Top 20 longest running workspaces in the last month
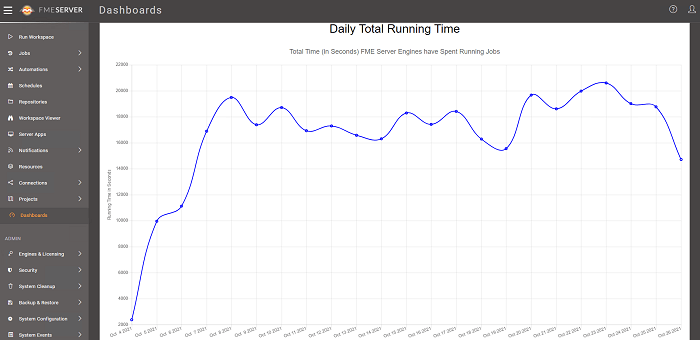
Graphic showing the total time (in seconds) FME Server engines have spent running jobs
A fully customizable tool
The five default reports are just the tip of the iceberg of what Dashboards can do, and your imagination is the only limit when it comes to creating the monitoring elements you need. There is no cap on the number of reports and no limits on the data that can be used or the frequency or format of reports. This includes the ability to change report metrics, add tabular information and even use information in map format.
These reports are generated with a mechanism that triggers the following steps:
- A workspace (included by default) retrieves the desired statistical information in CSV format from the FME Server API.
- The CSV file of statistical information (run date and time, time spent waiting in the queue, status, etc.) is then stored.
- The file is added to FME Server’s repository, which triggers a series of workspaces (including the default five) and writes HTML files via HTMLReportGenerator transformers.
- These files automatically appear on the Dashboard page of the FME Server interface.
To customize an existing report or to create a new one, all you have to do is create new workspaces. They’ll generate new HTML reports that you can access from the Dashboards page of FME Server.
Creating or modifying new reports is not a very complex task, technically speaking, but, even once they let their creativity flow, some FME Server administrators may have some trouble identifying the monitoring techniques that best meet the needs of their organization. Here are a few sample reports to inspire you:
Custom report examples
Percentage of failures by workspace
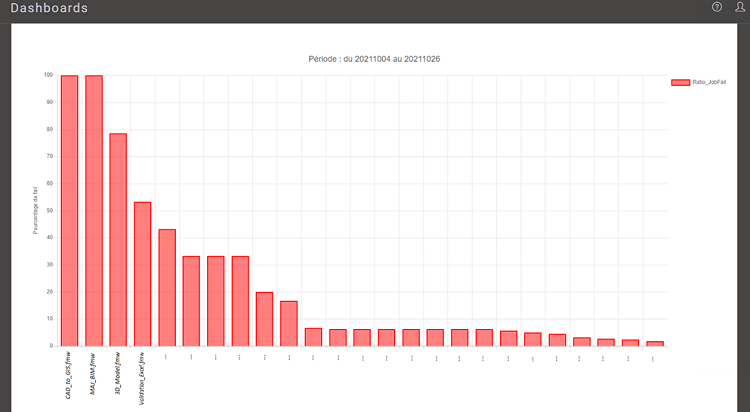
Graphic showing the percentage of failures per workspace
This custom graphic shows the absolute number of failures, rather than the relative number originally defined in default report number 2. This information might be useful to, for example, an organization that runs “non-critical” processes 50 times a day, as well as “highly critical” processes that run once during the night. Also, if a data set has been recently updated or a workspace modified, the admin will be able to analyze fluctuations in the failure rates and come up with a recovery strategy if necessary.
Average workspace run time by category
As their number of processes goes up, many platform admins may be concerned about managing their FME Server engine usage rate. Sometimes they might want to identify free slots where they could insert new scheduled tasks, or want to know what types of tasks are hogging their FME Server.
In cases like these, you can create a report with the average run time of workspaces, divided by category. By analyzing the specific run time of your scheduled tasks, you can then predict your FME Server’s usage rates, and that in turn allows you to analyze usage percentages for other categories, namely those triggered by Automations, those from applications and from other manually launched workspaces.
As you can see, FME Server is a complete, constantly evolving data integration platform. Not only can it manage multiple data processing and integrations between applications, but it also offers a wide range of monitoring possibilities. This is often a smart strategy, especially for organizations that are data driven or operate in a context that calls for sound governance rules.
Looking to implement an FME Server monitoring and governance strategy?